Image Details
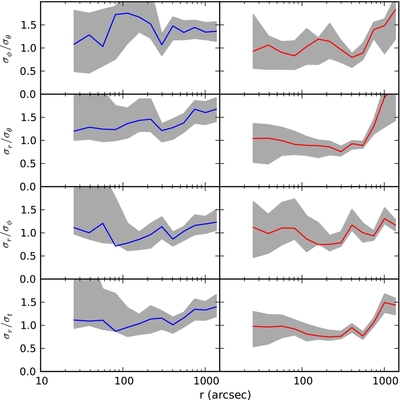
Caption: Figure 5.
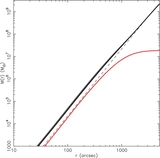
Anisotropy in various components of the velocity dispersion tensor. Shaded regions correspond to the 68% confidence regions; solid lines plot the best-fit model. Left- and right-hand panels plot stars near the major and minor axes, respectively.
Other Images in This Article
Copyright and Terms & Conditions
© 2012. The American Astronomical Society. All rights reserved.
Copyright ©
2025 Astronomy Image Explorer. All Rights Reserved.