Image Details
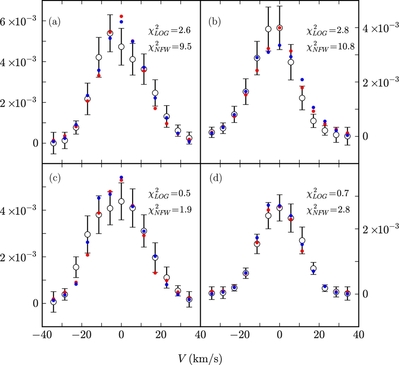
Caption: Figure 1.
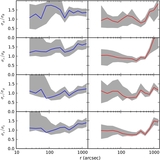
Line-of-sight velocity distributions of four bins. Open circles with error bars are the data. Overplotted are the model values for the best-fitting cored model (red) and NFW model (blue). Bins are located at (a) R = 297'', θ = 18°; (b) R = 550'', θ = 18°; (c) R = 1008'', θ = 45°; and (d) R = 2484'', θ = 45°. Quoted χ 2 values are unreduced.
Other Images in This Article
Copyright and Terms & Conditions
© 2012. The American Astronomical Society. All rights reserved.
Copyright ©
2025 Astronomy Image Explorer. All Rights Reserved.