Image Details

Caption: Figure 8.
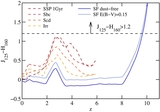
Evolution of the UV luminosity density ρ L above M 1400 = −18 mag (>0.06 L z = 3 *). The filled circle at z ~ 10.4 is the luminosity density directly measured for our only z ~ 10 galaxy candidate. The two connected dots at z = 10 show the range of possible LD values, given the two simple, accelerated extrapolations of the UV luminosity function described in Section 4.3. The red line corresponds to the empirical LF evolution from Bouwens et al. (2011b). Its extrapolation to z > 8 is shown as a dashed red line. The ρ L data at z ~ 4–8 are taken from Bouwens et al. (2007) and Bouwens et al. (2011b). As can be seen, ρ L increases by more than an order of magnitude in 170 Myr from z ~ 10 to z ~ 8, indicating that the galaxy population at this luminosity range evolves by a factor ⩾4 more than expected from low redshift extrapolations. The predicted ρ L evolution of the semi-analytical model of Lacey et al. (2011) is shown as a dashed blue line, and the theoretical model prediction of Trenti et al. (2010) is shown as a blue solid line. These reproduce the expected luminosity density at z ~ 10 remarkably well.
Other Images in This Article

Copyright and Terms & Conditions
© 2012. The American Astronomical Society. All rights reserved.