Image Details
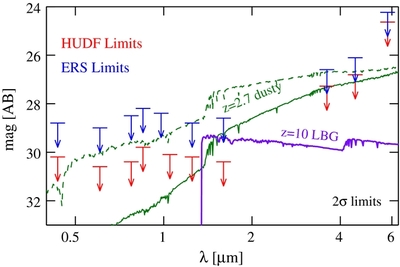
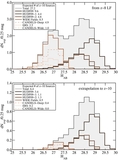
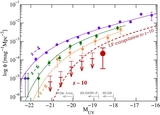
Caption: Figure 3.
Sensitivity limits (2σ) of some of the data used in this analysis. The red arrows indicate the limits of the ACS, WFC3/IR, and IRAC data over HUDF, while blue arrows correspond to the ERS data set. The SED of a z = 10 star-forming galaxy is plotted in purple, showing the distinguishing feature of complete absorption shortward of the redshifted Lyα line. Evolved and dusty galaxy SEDs can mimic the same features as a z ~ 10 source, i.e., red J 125 − H 160 and undetected in the optical data, unless this is extremely deep. Such sources are typically detected in the IRAC data. Alternatively, the solid and dashed green lines show possible SEDs of z ~ 2.7 galaxies which could escape the IRAC detection at 2σ. These correspond to evolved galaxies (500 Myr), with moderate amounts of dust extinction, and are normalized to the 5σ detection limits of the H 160 bands. Note that much larger amounts of dust can be hidden for interloper galaxies at the detection limit of the HUDF (green solid, A V = 2.0 mag) than for the ERS (green dashed, A V = 0.6 mag). Thus, even with IRAC it can be a challenge to separate real z ~ 9–10 sources from lower redshift contaminants.
Other Images in This Article

Copyright and Terms & Conditions
© 2012. The American Astronomical Society. All rights reserved.