Image Details
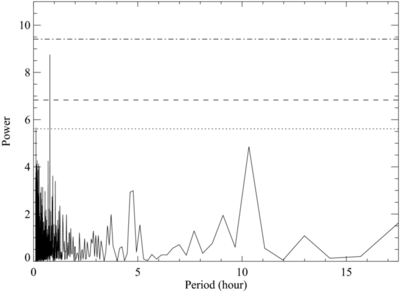
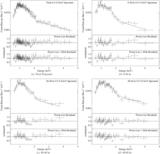
Caption: Figure 3.
Searching for periodicities in the Chandra light curve of NGC 300 X-1 using a periodogram analysis. The dotted, dashed, and dot-dashed lines represent the 68%, 90%, and 99% confidence levels, respectively.
Other Images in This Article
Copyright and Terms & Conditions
© 2011. The American Astronomical Society. All rights reserved.
Copyright ©
2025 Astronomy Image Explorer. All Rights Reserved.