Image Details
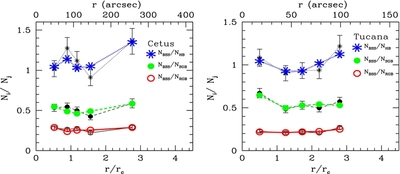
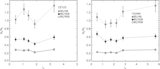
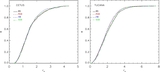
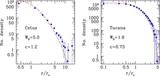
Caption: Figure 9.
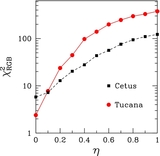
Simulated radial distribution of
 ,
,
 , and
, and
 in Cetus (left panel) and in Tucana (right panel). Thin lines indicate the observed radial distributions, for comparison
with the best match simulations (runs C3 and T3 for Cetus and Tucana, respectively). Error bars account for Poisson uncertainties.
in Cetus (left panel) and in Tucana (right panel). Thin lines indicate the observed radial distributions, for comparison
with the best match simulations (runs C3 and T3 for Cetus and Tucana, respectively). Error bars account for Poisson uncertainties.
Other Images in This Article

Show More
Copyright and Terms & Conditions
© 2012. The American Astronomical Society. All rights reserved.
Copyright ©
2025 Astronomy Image Explorer. All Rights Reserved.