Image Details
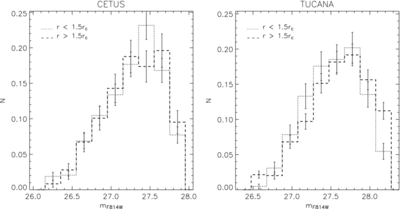
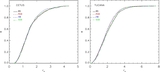
Caption: Figure 4.
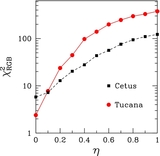
Normalized luminosity function of the candidate BSS population in Cetus (left panel) and Tucana (right panel). The different lines refer to the BSS stars within (dotted) and outside (dashed) 1.5 r c from the center.
Other Images in This Article

Show More
Copyright and Terms & Conditions
© 2012. The American Astronomical Society. All rights reserved.
Copyright ©
2025 Astronomy Image Explorer. All Rights Reserved.