Image Details
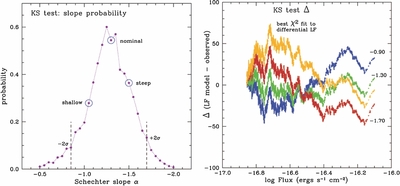
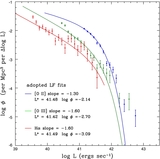
Caption: Figure 7.
K-S test results of fitting Schechter functions to the [O ii] counts. Left: the probability of fit for different values of the slope α and luminosity L*. The two vertical dashed lines mark the slopes of α = −0.85 and α = −1.70, representing fits that are rejected at the ~95% level (2σ). Right: four examples of the fractional deviations Δ for best-fit Schechter functions and the [O ii] counts. The larger the amplitude of the S-wave shape of the Δ distribution, the poorer the fit. The best fit, α = −1.30, is nearly flat—well within the 1σ interval of "goodness of fit" of −1.05 to −1.50. The best χ 2 fit, shown in gold, shows a stronger S-wave that indicates rejection at the P > 97% level.
Other Images in This Article
Show More
Copyright and Terms & Conditions
© 2011. The American Astronomical Society. All rights reserved.