Image Details
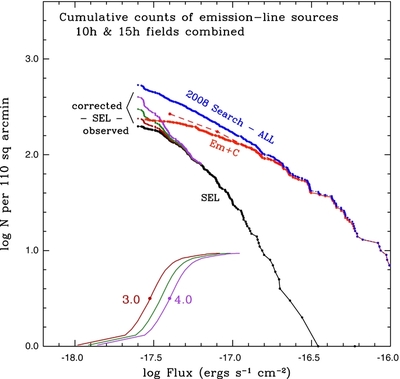
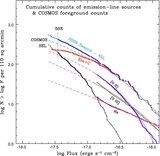
Caption: Figure 4.
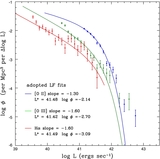
Cumulative source counts formed for both the 10h (COSMOS) and 15h (LCIRS) fields, in log 10 number per 110 arcmin 2, the combined area surveyed in the two fields. The red line shows the cumulative counts of "Em+C" (emission-line sources with blue continua); the black line shows the counts of "SEL" (single-emission-line-only) sources. The faint end of the latter is shown in raw counts as well as after correction for three different values of the completeness correction (see the text), at 50% incompleteness levels of F = 3.0, 3.5, and 4.0 × 10 −18 erg s −1 cm −2. (The form of the incompleteness function is shown at the bottom of the figure, and the correction applied to the observed counts—the black line—is shown in red, green, and purple for the these three bounding values of the 50% completeness level.) The red line Em+C distribution has not been corrected for this incompleteness, but for a larger effect that results from the increasing difficulty of detecting a continuum for progressively fainter emission lines. The dashed red line is an estimate of the correction that is needed because of this effect. As explained in the text, the "ALL" line, a sum of the uncorrected Em+C counts and the SEL counts corrected for the "3.5" incompleteness, has instead been chosen as the basis for the subsequent analysis of the LAE luminosity function.
Other Images in This Article
Show More
Copyright and Terms & Conditions
© 2011. The American Astronomical Society. All rights reserved.