

Image Details
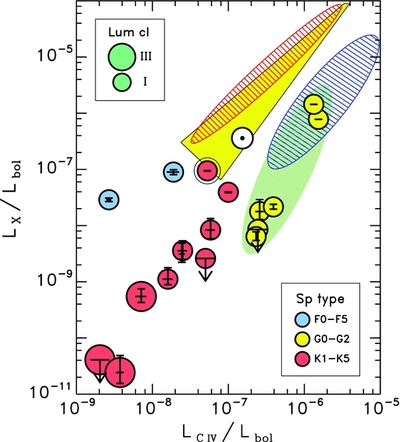
Caption: Figure 3.
X-ray(0.2–2 keV)/C iv flux–flux diagram illustrating systematic behaviors of different classes of late-type stars, explicitly highlighting supergiants (smaller circles) and low-activity red giants (larger circles). Normalizing by bolometric luminosity removes twin biases of different stellar sizes and distances. The yellow wedge is where G and K dwarfs are found: ☉ marks the average Sun. The red hatched oval is the region populated by active mid- to late-G giants, and the blue hatched zone is for F dwarfs and F–G0 "Hertzsprung-gap" giants. The green oval marks the G-type yellow supergiants: high-activity at top, low activity at bottom. The leftmost blue circle is α Per; the other blue circle is for the comparison supergiant Canopus (α Car). The circled dot next to α Car is the red supergiant α TrA, for which HST imaging detected a close-in faint companion, consistent with a low-mass star. Supergiants are young, so coeval dwarf companions can be coronally hyperactive.
Other Images in This Article

Copyright and Terms & Conditions
© 2011. The American Astronomical Society. All rights reserved.

