

Image Details
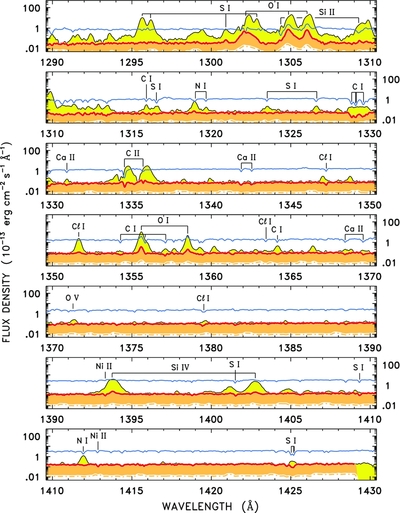
Caption: Figure 1.
Broad view of COS G130M-1291 spectrum of α Per (red curve/orange shaded; orange dot-dashed curve is the smoothed photometric error), and two comparison supergiants: β Aqr (G0 Ib: black curve/yellow shaded) and α Car (F0 II: blue curve). The last two spectra are from STIS, filtered to COS resolution. The α Per tracing was smoothed for display by a sub-resolution Gaussian (10 km s −1 FWHM). The flux density ordinate refers to α Per; the other stars were scaled by the relative bolometric fluxes, f bol, to compensate for the different stellar sizes and distances.
Other Images in This Article
Copyright and Terms & Conditions
© 2011. The American Astronomical Society. All rights reserved.

Copyright ©
2026 Astronomy Image Explorer. All Rights Reserved.
