Image Details
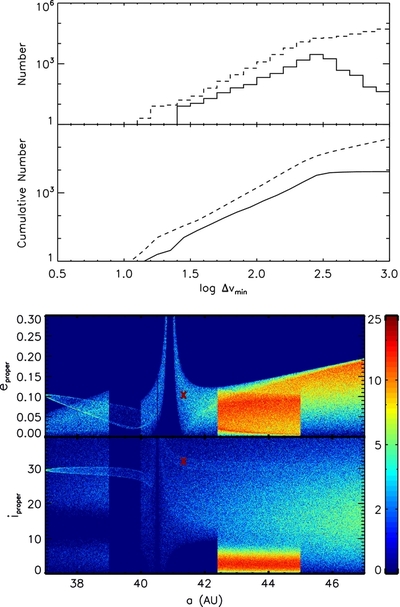
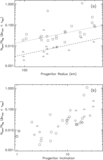
Caption: Figure 3.
Histogram (panel 1) and cumulative number (panel 2) of KBOs with m v ⩽ 28 vs. log Δ v min for the same family shown in Figure 2. The family members (solid line) are now outnumbered by the background objects (dashed line) nearly ten to one. Panels 3 and 4 show the orbital element distribution of the synthetic KBO population for all bodies with m v ⩽ 28, including the collisional family in Figure 2. The red "X" indicates the location of the family's largest remnant. Note that the clumping of family members is still discernible to the naked eye in inclination vs. semimajor axis, though this is partly due to our choice of a single velocity kick; a realistic distribution of velocities would not make a collisional cloud with such a prominent boundary. Also note that the color bar scale has changed from previous figures.
Other Images in This Article


Copyright and Terms & Conditions
© 2011. The American Astronomical Society. All rights reserved.