Image Details
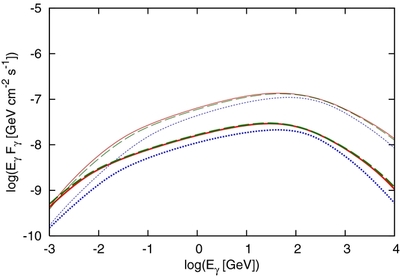
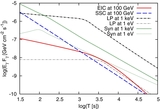
Caption: Figure 12.
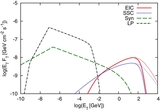
EIC spectra calculated with different values of
E
b
. Intrinsic EIC spectra (where the EBL attenuation is not taken into account) are shown at
T = 10
2.6 s (thin) and
T = 10
3.6 s (thick). The source redshift is set to
z = 0.3. For the solid curves, the used parameter set is the same as that in the caption of Figure
3. The dotted curves are for
E′
b
= 10
2.5 eV and the dashed curves are for
 , while the other parameters are the same.
Other Images in This Article
Show More
Copyright and Terms & Conditions
© 2011. The American Astronomical Society. All rights reserved.
Copyright ©
2025 Astronomy Image Explorer. All Rights Reserved.