Image Details
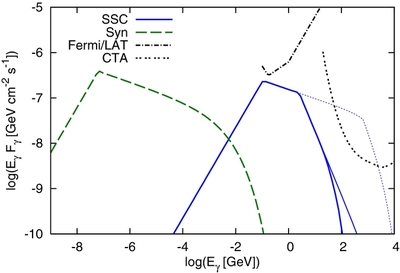
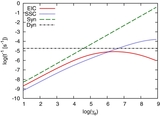
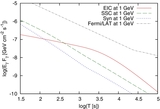
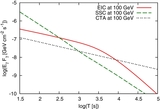
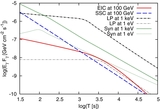
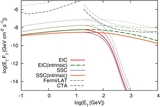
Caption: Figure 1.
Spectra of synchrotron and SSC emission in the magnetic dissipation model for late prompt emission at T = 10 3 s. The source redshift is taken to z = 1. Assumed parameters are L B | T′ a = L e | T′ a = 10 48.5 erg s −1, σ = 10 1.4, Γ LP = 5, and r i = 10 15.75 cm. The thick solid curve represents an SSC spectrum taking into account attenuation by pair creation both inside and outside the source. An SSC spectrum shown as the thin sold curve includes only the source attenuation, while the thin dotted curve spectrum does not include either of them. The Fermi/LAT and CTA sensitivities (with the duty factor of 30%) are also overlayed (CTA Consortium 2010). The LAT sensitivity curves in the sky survey mode are used for the long time observations, although the possible continuous observations by LAT may improve the detectability by a factor of 3–5 (e.g., Gou & Mészáros 2007).
Other Images in This Article
Show More
Copyright and Terms & Conditions
© 2011. The American Astronomical Society. All rights reserved.