Image Details
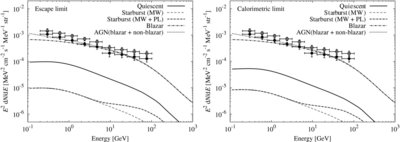
Caption: Figure 4.
EGRB spectrum. The theoretical predictions for the contributions from quiescent and starburst galaxies are shown separately, for the escape limit (left panel) and the calorimetric limit (right). For starburst galaxies, we plotted two cases corresponding to two different spectral shapes of MW and MW + power law. For comparison, the EGRB models of blazars and all AGNs (blazar + non-blazar) by Inoue & Totani (2009) including resolved sources. Open circles show the total EGRB flux reported by Fermi (Abdo et al. 2010c) including resolved sources, and the filled circles are the same but for the unresolved diffuse flux excluding resolved sources. The model curves should be compared with the open circle data.
Other Images in This Article


Copyright and Terms & Conditions
© 2011. The American Astronomical Society. All rights reserved.