

Image Details
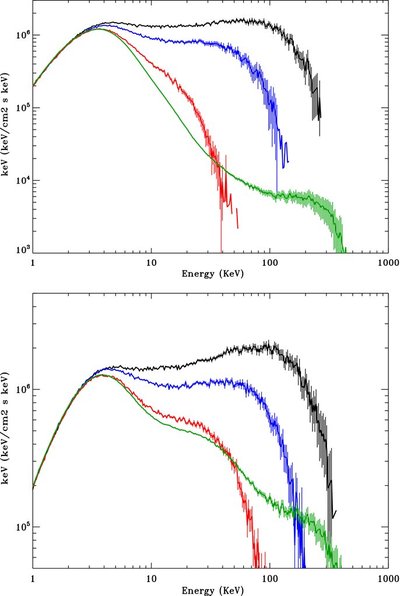
Caption: Figure 5.
Spectral evolution as a function of mass accretion rate: upper panel:
C
1/
C
0 = 5 and bottom panel: for
C
1/
C
0 = 10. Black, blue, red, and green histograms correspond to
 , and 5, respectively.
Other Images in This Article
Copyright and Terms & Conditions
© 2011. The American Astronomical Society. All rights reserved.

Copyright ©
2026 Astronomy Image Explorer. All Rights Reserved.
