

Image Details
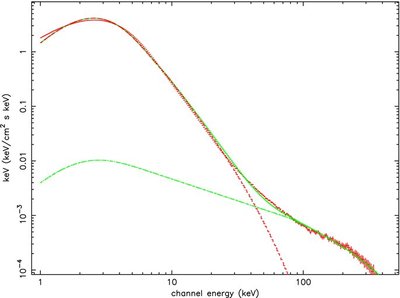
Caption: Figure 4.
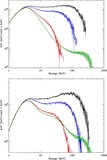
Example of simulated bulk+thermal Comptonization spectrum (red histogram) and the XSPEC model
bmc1 * highcut1 + bmc2 * highcut2. The spectrum is shown in units of keV (keV cm
−2s
−1keV
−1) with absolute values that are multiplied by an arbitrary constant. The hard and soft components are shown by dash green
and dash red curves, respectively. The resulting spectrum is shown by a solid green curve. In the simulations, the mass accretion
rate in Eddington units is
 ,
C
1/
C
0 = 5,
q = 0.01, and the flow electron temperature is
kT
e
= 2.4 keV.
,
C
1/
C
0 = 5,
q = 0.01, and the flow electron temperature is
kT
e
= 2.4 keV.
Other Images in This Article
Copyright and Terms & Conditions
© 2011. The American Astronomical Society. All rights reserved.

