Image Details
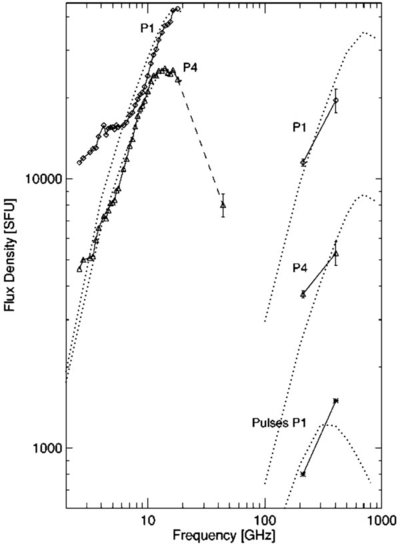
Caption: Figure 2.
Calculated GS emission spectra (dotted lines) superimposed on the submillimeter data from SST, MW data from OVSA at peaks P1 and P4, and the mean spectrum of the flux of pulse emission at peak P1 from SST (see the original Figure 4 given by Kaufmann et al. 2004).
Other Images in This Article
Copyright and Terms & Conditions
© 2011. The American Astronomical Society. All rights reserved.
Copyright ©
2025 Astronomy Image Explorer. All Rights Reserved.