Image Details
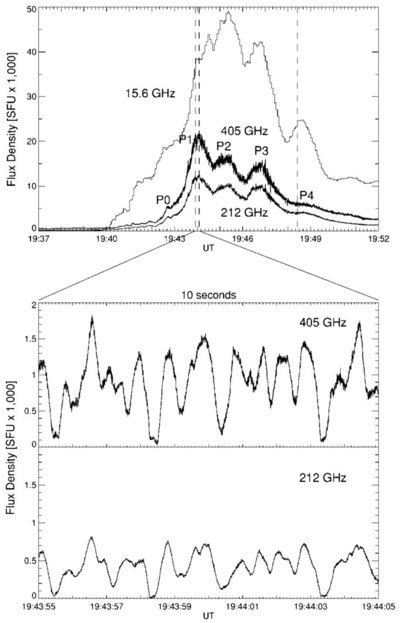
Caption: Figure 1.
Time profiles of the burst at 405, 212, and 15.6 GHz (top) obtained, respectively, with SST and OVSA in units of thousands of solar flux units. An example of the intense subsecond pulses is shown over a 10 s period during the first peak P1 at the bottom (Kaufmann et al. 2004).
Other Images in This Article
Copyright and Terms & Conditions
© 2011. The American Astronomical Society. All rights reserved.
Copyright ©
2025 Astronomy Image Explorer. All Rights Reserved.