Image Details
Caption: Figure 4.
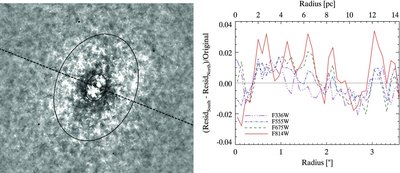
Figures showing a small asymmetry in the M32 nucleus. Left: the model-subtracted F555W image oriented with N up and E to the
left. Black solid lines show the annulus with major axes of 0
![]() 45–1
45–1
![]() 8, while the dashed line separates the northern and southern halves of this annulus. Right: comparison of the residuals of
the model-subtracted images. The
Y-axis plots the difference in flux between the southern and northern annuli in the model-subtracted images normalized by the
original image. A 1%–2% excess in the southern annulus is seen in all bands from 0
8, while the dashed line separates the northern and southern halves of this annulus. Right: comparison of the residuals of
the model-subtracted images. The
Y-axis plots the difference in flux between the southern and northern annuli in the model-subtracted images normalized by the
original image. A 1%–2% excess in the southern annulus is seen in all bands from 0
![]() 45 to 1
45 to 1
![]() 8 (2–7 pc).
8 (2–7 pc).
Other Images in This Article


Copyright and Terms & Conditions
© 2010. The American Astronomical Society. All rights reserved.
Copyright ©
2025 Astronomy Image Explorer. All Rights Reserved.