Image Details
Caption: Figure 1.
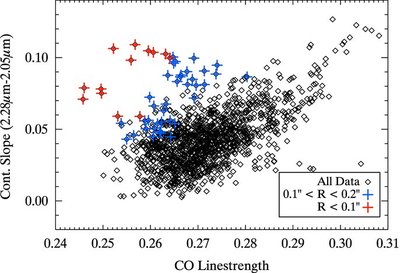
CO line strength plotted against the continuum slope. Positive values indicate deeper CO lines and redder continuum slopes.
Spaxels between 0
![]() 1 and 0
1 and 0
![]() 2 of the center are shown with blue crosses and those within 0
2 of the center are shown with blue crosses and those within 0
![]() 1 with red crosses. The deviation toward redder colors and weaker CO lines is due to emission from hot dust. The slope is
measured from the flux ratioed spectra, thus a value of zero indicates the same spectral slope as an A0 star. Errors on the
CO depths are ≲0.005 and on the continuum slopes are ≲0.0002.
1 with red crosses. The deviation toward redder colors and weaker CO lines is due to emission from hot dust. The slope is
measured from the flux ratioed spectra, thus a value of zero indicates the same spectral slope as an A0 star. Errors on the
CO depths are ≲0.005 and on the continuum slopes are ≲0.0002.
Other Images in This Article
Copyright and Terms & Conditions
© 2010. The American Astronomical Society. All rights reserved.
Copyright ©
2025 Astronomy Image Explorer. All Rights Reserved.