Image Details
Caption: Figure 9.
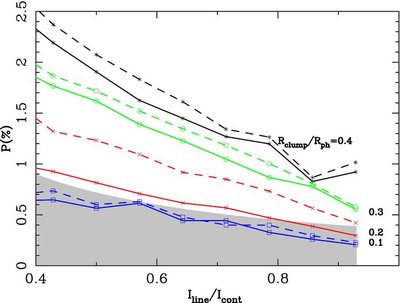
Results of Monte Carlo simulations of random obscuring spherical clumps in front of a spherical photosphere. The models are
shown for clump scales of
R
clump/
R
, = 0.1 (blue
 ), 0.2 (red ×), 0.3 (green
![]() ), and 0.4 (black *). Solid lines are for simulations with
k = 0.5, while dashed lines indicate simulations with
k = 0. The shaded area indicates the permitted values of line polarization, according to Equation (3), for a continuum polarization
of 0.36% determined by Chornock et al. (2006). Lower values of the continuum polarization (0.17% determined here) place even
stricter upper limits on the scale of clumping. Minor fluctuations in the curves are due to the statistical nature of the
Monte Carlo simulations; except for the case of
R
clump/
R
ph = 0.4 for
I
line/
I
cont>0.8, where the results are dominated by the finite size of the "pixels" that compose the model photosphere.
), and 0.4 (black *). Solid lines are for simulations with
k = 0.5, while dashed lines indicate simulations with
k = 0. The shaded area indicates the permitted values of line polarization, according to Equation (3), for a continuum polarization
of 0.36% determined by Chornock et al. (2006). Lower values of the continuum polarization (0.17% determined here) place even
stricter upper limits on the scale of clumping. Minor fluctuations in the curves are due to the statistical nature of the
Monte Carlo simulations; except for the case of
R
clump/
R
ph = 0.4 for
I
line/
I
cont>0.8, where the results are dominated by the finite size of the "pixels" that compose the model photosphere.
Other Images in This Article


Copyright and Terms & Conditions
© 2010. The American Astronomical Society. All rights reserved.