Image Details
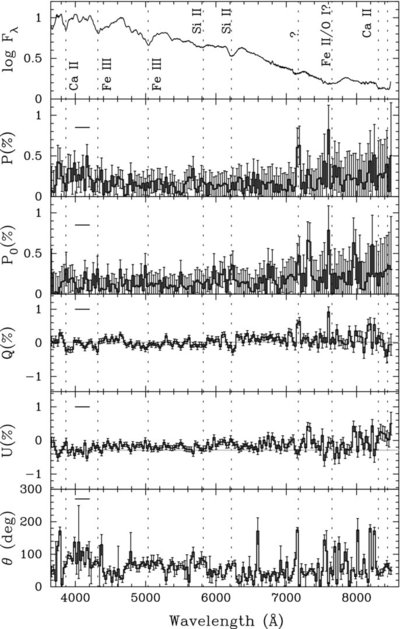
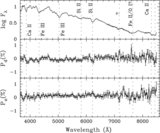
Caption: Figure 3.
Spectropolarimetry of SN 2005hk on 2005 November 9. The six panels (from top to bottom) give the observed flux spectrum, in logarithmic flux units (erg s -1 cm −2 Å −1); the observed polarization spectrum ( P); the observed polarization spectrum corrected for the ISP component ( P 0); the Stokes Q and U spectra uncorrected for the ISP (the value of the ISP is shown for each parameter by the gray line); and the polarization angle θ. Line identifications are provided in the top panel and are based on the identifications by Chornock et al. (2006), Branch et al. (2004), Phillips et al. (2007) and comparison with synthetic spectra produced using the SYNOW code. The data have been rebinned to 30 Å for clarity. The wavelength range selected for the determination of the ISP is shown by the heavy lines.
Other Images in This Article


Copyright and Terms & Conditions
© 2010. The American Astronomical Society. All rights reserved.