Image Details
Caption: Figure 3.
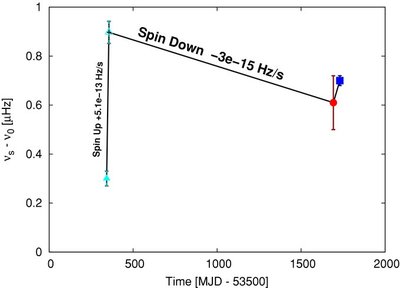
Long-term spin frequency evolution of the pulsar in IGR J00291. The spin frequencies are plotted with an offset ν
0 = 598.8921300 Hz. The symbols and colors are the same as those in Figures
1 and
2. The red circle and blue square are the average spin frequencies as measured in the first and second 2008 outbursts. The
cyan triangle is the spin frequency at the beginning of the 2004 outburst and the open cyan triangle is the spin frequency
at the end of the 2004 outburst, after a spin-up has taken place. The spin frequency during the first 2008 weak outburst has
decreased with respect to 2004 and requires a spin-down in quiescence of
 .
.
Other Images in This Article
Copyright and Terms & Conditions
© 2010. The American Astronomical Society. All rights reserved.