Image Details
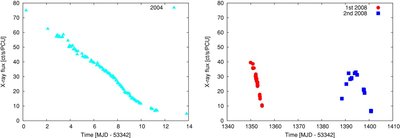
Caption: Figure 1.
X-ray light curves of the two outbursts of IGR J00291. The left panel shows the 2004 data, whereas the right one refers to the 2008 data. The y-axis is the same in the two plot, while the x-axis is not. In 2008 two faint outbursts are observed, with peak luminosities about half the value of 2004. The respective shapes of 2004 and the first 2008 outburst are remarkably similar, whereas the second 2008 outburst shows a bell-shape light curve. In the plot only points in which pulsations are detected are shown, which correspond to minimum counts of approximately 8 counts s −1 PCU −1.
Other Images in This Article
Copyright and Terms & Conditions
© 2010. The American Astronomical Society. All rights reserved.
Copyright ©
2025 Astronomy Image Explorer. All Rights Reserved.