Image Details
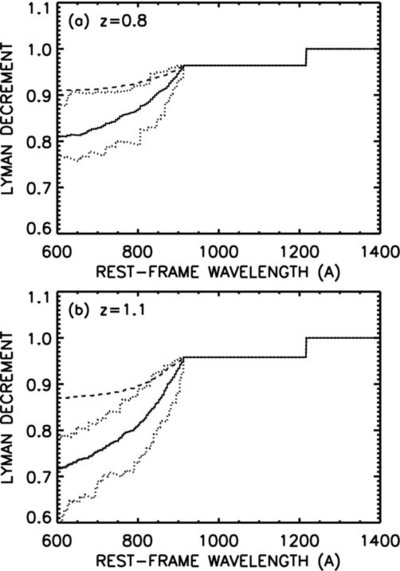
Caption: Figure 6.
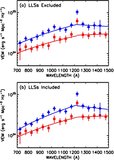
Monte Carlo estimates of the photoelectric absorption decrements at (a) z = 0.8 and (b) z = 1.1 obtained from averaging (in each case) 1000 lines of sight. The dashed curves only show the values from systems with optical depths less than one at the Lyman edge, while the solid curves show the values from all systems regardless of their optical depths. The dotted curves show the range of corrections for 20 computations of only 60 lines of sight, which is similar to the number of systems that we have in each redshift interval.
Other Images in This Article
Copyright and Terms & Conditions
© 2010. The American Astronomical Society. All rights reserved.
Copyright ©
2025 Astronomy Image Explorer. All Rights Reserved.