Image Details
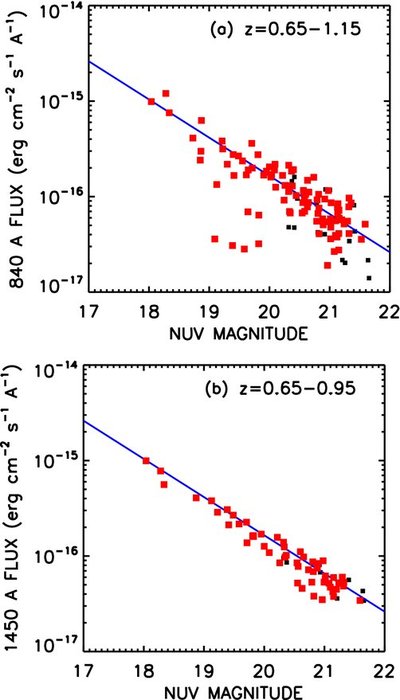
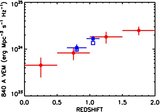
Caption: Figure 3.
(a) Observed flux from the GALEX spectra at rest-frame 800–880 Å vs. NUV magnitude for sources in the redshift interval z = 0.65–1.15. Red squares denote sources classified as AGNs due to the presence of high-excitation lines, while black squares show the unclassified sources in this redshift interval. The blue line shows a linear fit to the data. (b) Same as (a), but for rest-frame 1400–1500 Å and restricted to z = 0.65–0.95, where the GALEX NUV spectra cover the rest-frame wavelengths. The blue line shows the expected value of the flux determined from the NUV-continuum magnitude, since the redshifted 1400–1500 Å matches closely to the NUV wavelength. There is a very small multiplicative factor (0.95) between the flux measured from the spectra and the flux measured from the broadband magnitudes.
Other Images in This Article
Copyright and Terms & Conditions
© 2010. The American Astronomical Society. All rights reserved.