Image Details
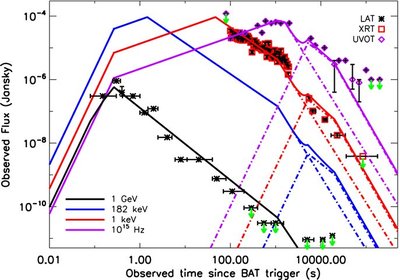
Caption: Figure 2.
GRB 090510 broadband modeling in the synchrotron ES scenario. Data are taken from the light curves in Figure 1 of De Pasquale
et al. (2010), where the mean flux measured in each energy range for the different instruments (
Fermi/LAT,
Swift/XRT, and
Swift/UVOT) has been rescaled to give the measured flux at each specific frequency (1 GeV, 1 keV, and 10
15 Hz). This is done by requiring at 100 s the specific flux value reported in the SED plotted in Figure 2 of De Pasquale et
al. (2010). The black, red, and purple solid lines represent the model predictions at 1 GeV, 1 keV, and 10
15 Hz, respectively. Parameters are set as follows—for the narrow and wide jet components (dash-dotted lines), respectively:
![]() e
= 0.1,
e
= 0.1,
![]() B
= 3 × 10
−3,
n = 10
−6, Γ
0,
n
= 10
4,
E
iso,n = 3.7 × 10
53 erg,
p
n
= 2.3, θ
j,
n
= 0
B
= 3 × 10
−3,
n = 10
−6, Γ
0,
n
= 10
4,
E
iso,n = 3.7 × 10
53 erg,
p
n
= 2.3, θ
j,
n
= 0
![]() 12, Γ
0,
w
= 220,
E
iso,w = 1.5 × 10
53 erg,
p
w
= 2.5, and θ
j,
w
= 0
12, Γ
0,
w
= 220,
E
iso,w = 1.5 × 10
53 erg,
p
w
= 2.5, and θ
j,
w
= 0
![]() 43. The blue lines represent the contribution of the narrow and wide jet components at the middle of the BAT energy band;
throughout the evolution this is below the data/upper-limits reported in De Pasquale et al. (2010), in agreement with our
hypothesis that the emission observed in the GBM/BAT/MCAL energy range should be due to IS rather than to ES.
43. The blue lines represent the contribution of the narrow and wide jet components at the middle of the BAT energy band;
throughout the evolution this is below the data/upper-limits reported in De Pasquale et al. (2010), in agreement with our
hypothesis that the emission observed in the GBM/BAT/MCAL energy range should be due to IS rather than to ES.
Other Images in This Article
Copyright and Terms & Conditions
© 2010. The American Astronomical Society. All rights reserved.