Image Details

Caption: Figure 1.
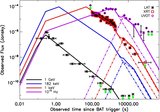
Modeling of the high-energy emission during interval II in the IS scenario (Guetta & Granot 2003). The red arrow marks the level of BAT upper-limits (see, e.g., De Pasquale et al. 2010) while the green diamond marks the level of the flux observed by the LAT around 1 GeV (see Figure 2 in Abdo et al. 2009b).
Other Images in This Article
Copyright and Terms & Conditions
© 2010. The American Astronomical Society. All rights reserved.
Copyright ©
2025 Astronomy Image Explorer. All Rights Reserved.