Image Details
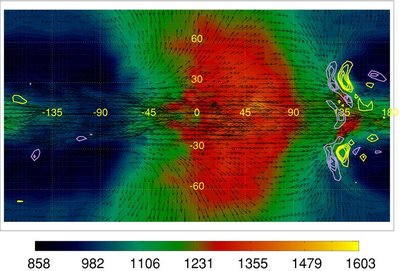
Caption: Figure 6.
Contours of horizontal flow convergence (in lavender) and divergence (in yellow) plotted over the temperature (in K) and wind map at the 150 mbar pressure level. The convergence/divergence contour levels are set at ±1 × 10 −4, 1.5 × 10 −4, 2 × 10 −4, and 2.5 × 10 −4 s −1. Clearly, the bulk of the flow has |∇ · v| < 1 × 10 −4 s −1. The narrow region of strong convergence around longitude +135° is what we refer to as a shock-like feature. An increase in temperature around longitude +135° seen in the bottom panel of Figure 1, just one model level below the one shown here, is consistent with adiabatic heating by a downward flow associated with this shock-like feature.
Other Images in This Article
Copyright and Terms & Conditions
© 2010. The American Astronomical Society. All rights reserved.