Image Details
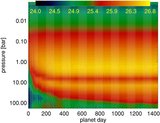
Caption: Figure 5.
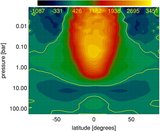
Temperature–pressure profiles at six points around the planet: the substellar point (thin solid), the antistellar point (dotted), the equator at the east terminator (dashed), the equator at the west terminator (dot-dashed), the north pole (triple-dot-dashed), and the south pole (long dashed). The thick solid lines show the radiative relaxation (forcing) temperature profiles at the substellar point and on the nightside above 10 bar, as well as the initial temperature profiles below 10 bar (where there is no radiative forcing by construction). Note the presence of a dynamically induced temperature inversion ("stratosphere") at the substellar point and significant deviations from radiative equilibrium all around the limb.
Other Images in This Article
Copyright and Terms & Conditions
© 2010. The American Astronomical Society. All rights reserved.