Image Details
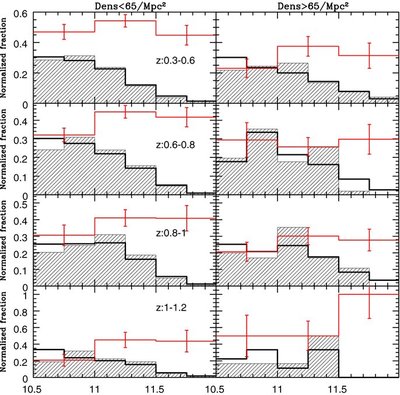
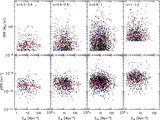
Caption: Figure 7.
Normalized distributions of the stellar mass for the optically selected sample (thick solid histogram) and for LIRGs (shaded histogram), in redshift bins. Left panels show the distributions for projected density <90 Mpc −2, right panels those for density >90 Mpc −2. Red histograms show the LIRG fraction to optically selected galaxies and Poisson errors.
Other Images in This Article
Copyright and Terms & Conditions
© 2010. The American Astronomical Society. All rights reserved.
Copyright ©
2025 Astronomy Image Explorer. All Rights Reserved.