Image Details
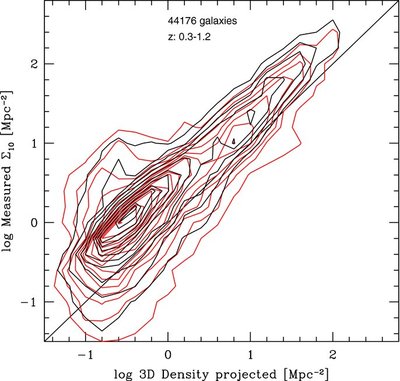
Caption: Figure 4.
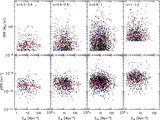
Isodensity contours of measured Σ 10 vs. projected 3D galaxy density, from the Millennium Simulation (black contours). Red contours: same relation where the error on photo- z is taken into account.
Other Images in This Article
Copyright and Terms & Conditions
© 2010. The American Astronomical Society. All rights reserved.
Copyright ©
2025 Astronomy Image Explorer. All Rights Reserved.