Image Details
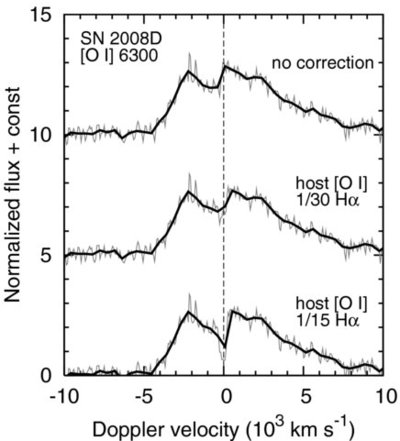
Caption: Figure 5.
[O i] line profile of SN 2008D and possible contamination by the narrow [O i] line from the H ii region. Top: line profile extracted as in Section 2.1 without correction of a possible narrow [O i] line. Middle and bottom: line profiles corrected for a possible narrow [O i] line. The strength of the narrow [O i] line is assumed to be 1/30 and 1/15 of the Hα line, respectively. The gray lines show unbinned spectra while the black lines show the spectra binned into 10 Å.
Other Images in This Article
Copyright and Terms & Conditions
© 2009. The American Astronomical Society. All rights reserved.
Copyright ©
2025 Astronomy Image Explorer. All Rights Reserved.