Image Details
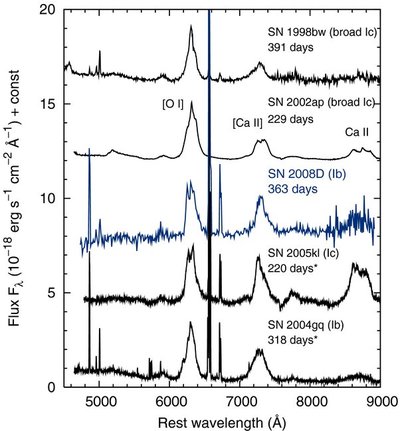
Caption: Figure 4.
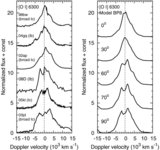
Nebular spectrum of SN 2008D (blue line) compared with that of SNe 1998bw (broad Ic; Patat et al. 2001), 2002ap (broad Ic; Mazzali et al. 2007), 2005kl (Ic; Maeda et al. 2008), and 2004gq (Ib; Maeda et al. 2008). The epochs are given as days since the explosion (days since the discovery are given for the two epochs marked with * as light curves are not available). The spectra are normalized to the peak flux of the [O i]λλ6300, 6364 line of SN 2008D. The spectra are shifted by 16, 12, 8, 4, and 0 from top to bottom for clarity.
Other Images in This Article
Copyright and Terms & Conditions
© 2009. The American Astronomical Society. All rights reserved.
Copyright ©
2025 Astronomy Image Explorer. All Rights Reserved.