

Image Details
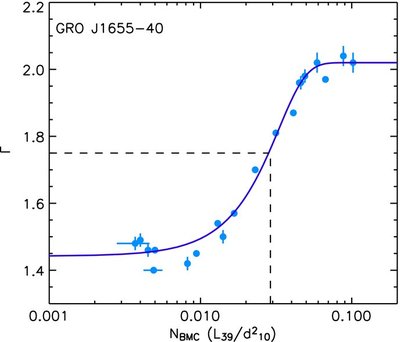
Caption: Figure 9.
Photon index plotted vs. the normalization of the BMC model for the microquasar GRO J1655-40 during the decay of the 2005 outburst (adapted from Shaposhnikov & Titarchuk 2009). The thick continuous line represents the best-fitting function of the spectral trend. The dashed lines illustrate how we determine the value of N BMC, r that we use in Equation (1) to estimate the black hole mass of the BLRG of 3C 390.3.
Other Images in This Article

Copyright and Terms & Conditions
© 2009. The American Astronomical Society. All rights reserved.

Copyright ©
2026 Astronomy Image Explorer. All Rights Reserved.
