

Image Details
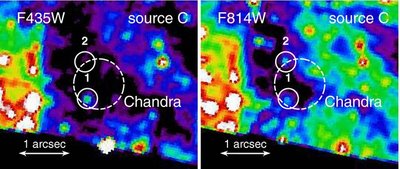
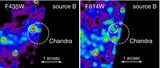
Caption: Figure 7.
HST ACS WFC images (in 2 of the 3 observed bands) centered around the position of source C, indicated with
r = 0
 5 dashed circles. The images were smoothed with a Gaussian with σ = 2 pixels (0
098). Detected optical sources tabulated in Table 1 are indicated with solid
r = 0
2 circles.
5 dashed circles. The images were smoothed with a Gaussian with σ = 2 pixels (0
098). Detected optical sources tabulated in Table 1 are indicated with solid
r = 0
2 circles.
Other Images in This Article
Copyright and Terms & Conditions
© 2009. The American Astronomical Society. All rights reserved.

Copyright ©
2026 Astronomy Image Explorer. All Rights Reserved.
