Image Details
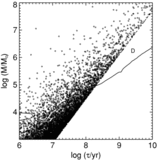
Caption: Figure 1.
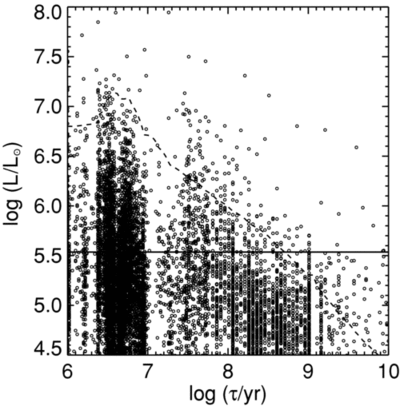
Luminosity–age plane for the Antennae clusters. The luminosities are in the V band and have been corrected for extinction. The dashed diagonal line is the evolutionary track of a model cluster with an initial mass of M = 2 × 10 5 M ☉ (Bruzual & Charlot 2003), while the solid horizontal line at L = 3 × 10 5 L ☉ is the approximate upper limit for stellar contamination. The vertical gap in the data points just above τ = 1 × 10 7 yr is an artifact caused by loops in the color tracks of stellar population models during the RSG phase (see the text).
Other Images in This Article

Show More
Copyright and Terms & Conditions
© 2009. The American Astronomical Society. All rights reserved.
Copyright ©
2025 Astronomy Image Explorer. All Rights Reserved.