Image Details
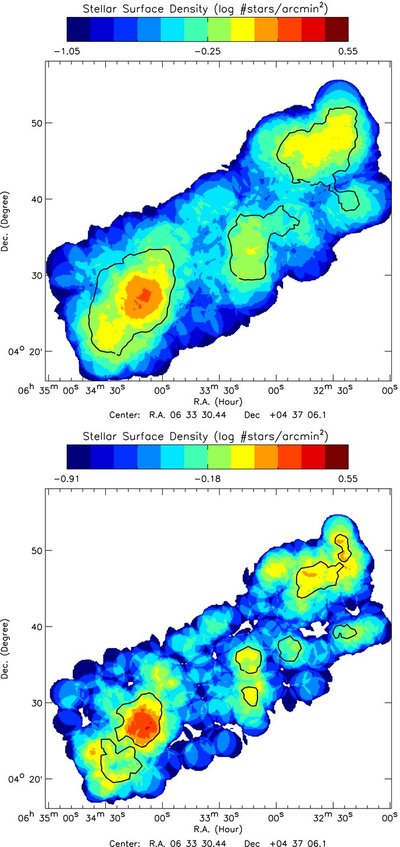
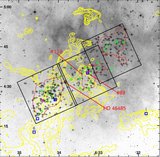
Caption: Figure 9.
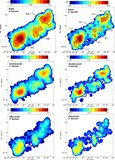
Stellar surface density (log #stars arcmin −2) map for a subsample of RMC sources (photon flux >1 × 10 −6 count cm −2 s −1) smoothed with a 3′ radius kernel (top panel) and a 2′ radius kernel (lower panel). The cluster regions and substructure regions from Figure 6 are shown.
Other Images in This Article

Show More
Copyright and Terms & Conditions
© 2009. The American Astronomical Society. All rights reserved.
Copyright ©
2025 Astronomy Image Explorer. All Rights Reserved.