Image Details
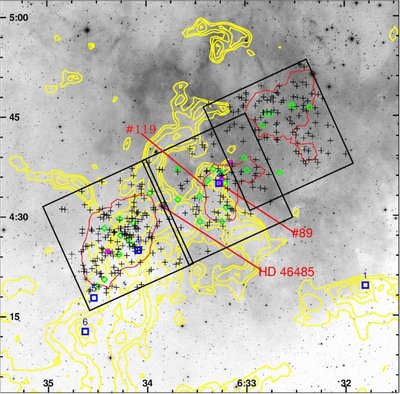
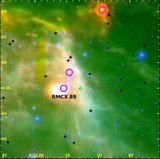
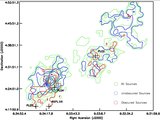
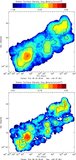
Caption: Figure 10.
Spatial distribution of all the IR counterparts to our X-ray sources. The dense molecular cloud is outlined by the 12CO emission contours (Heyer et al. 2006). Overlaid red polygons are the regions A, B, and C defined by X-ray source densities, and the symbols are the X-ray-selected stars classified as Class I (magenta circles), Class II (green diamonds), and Class III (black crosses) based on their NIR colors. The O7 star and the Class I protostar RMCX #89 are labeled. The overall distribution of the Class II/I sources is more confined to the CO molecular ridge than the Class III stars.
Other Images in This Article

Show More
Copyright and Terms & Conditions
© 2009. The American Astronomical Society. All rights reserved.