Image Details
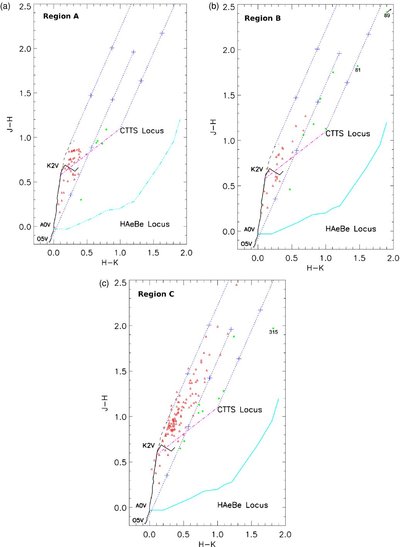
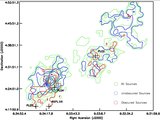
Caption: Figure 11.
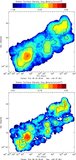
NIR J − H vs. H − K color–color diagram for Chandra stars with high-quality JHK photometry (error in both J − H and H − K colors <0.1 mag) in regions A, B, and C as defined in Figure 7. The green circles and red triangles represent sources with and without significant K-band excess ( E( H − K)>2σ( H − K)), respectively. The black solid and long-dashed lines denote the loci of MS stars and giants, respectively, from Bessell & Brett (1988). The purple dash-dotted line is the locus for classical T Tauri stars from Meyer et al. (1997), and the cyan solid line is the locus for HAeBe stars from Lada & Adams (1992). The blue dashed lines represent the standard reddening vector with crosses marking every A V = 5 mag.
Other Images in This Article

Show More
Copyright and Terms & Conditions
© 2009. The American Astronomical Society. All rights reserved.