Image Details
Caption: Figure 3.
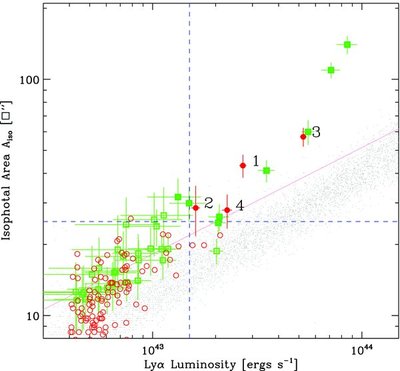
Distribution of isophotal areas and Lyα luminosities of Lyα-emitting sources (circles) selected with the first criteria (Figure 2). The horizontal and vertical dashed lines represent the selection criteria for the final Lyα blob candidate sample:  and
and  erg s−1, respectively. Gray dots represent the Aiso–LLyα relation for simulated point sources. Note that our four final blob candidates (filled circles) are located well above this relation (the solid line represents the upper 2σ limit), indicating that they are extended sources despite the poor seeing. Simulated point sources mix with extended Lyα-emitting sources below our selection limits on Aiso and LLyα, making it difficult to distinguish blobs from point sources there. The squares represent the predicted sizes and Lyα luminosities of the 35 Matsuda et al. (2004) blobs were they observed with our observational setup at z = 2.3. Our final blob candidate selection criteria (dashed lines) would find six to eight (filled squares) of the brightest and largest Matsuda et al. (2004) Lyα blobs (see Section 3.3).
Other Images in This Article
Copyright and Terms & Conditions
© 2009. The American Astronomical Society. All rights reserved.