Image Details
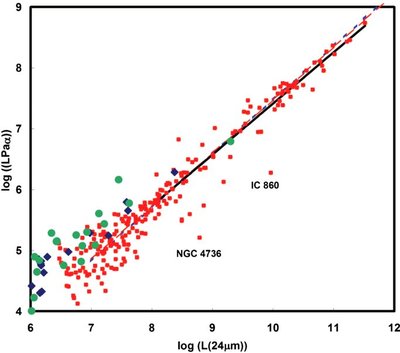
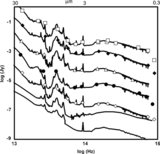
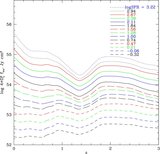
Caption: Figure 7.
Comparison of Paα and 24 μm luminosities. The red squares are for high metallicity galaxies and H ii regions as defined by Calzetti et al. (2007); the green circles are for intermediate metallicity; and the blue diamonds are for low metallicity. The fit (black line) is to the high metallicity points. The fits to subsets of the data by Alonso-Herrero et al. (2006) and Calzetti et al. (2007) are shown as dashed red and dashed blue lines, respectively.
Other Images in This Article
Show More
Copyright and Terms & Conditions
© 2009. The American Astronomical Society. All rights reserved.
Copyright ©
2026 Astronomy Image Explorer. All Rights Reserved.