Image Details
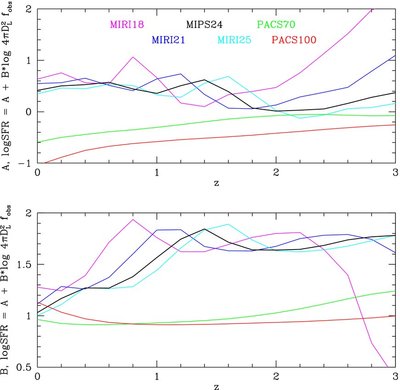
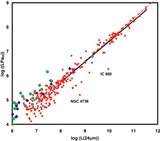
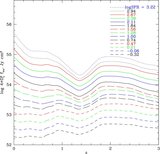
Caption: Figure 10.
Trends with redshift of the intercept A and slope B for the relation between SFR and infrared flux, log(SFR) = A + B(log(4π D 2 L f ν) − 53), for several infrared bands: Spitzer/MIPS 24 μm (heavy black line); Herschel/PACS 70 and 100 μm (green and red lines); JWST/MIRI 18, 21, and 25 μm (magenta, blue, and cyan lines).
Other Images in This Article
Show More
Copyright and Terms & Conditions
© 2009. The American Astronomical Society. All rights reserved.
Copyright ©
2026 Astronomy Image Explorer. All Rights Reserved.