Image Details
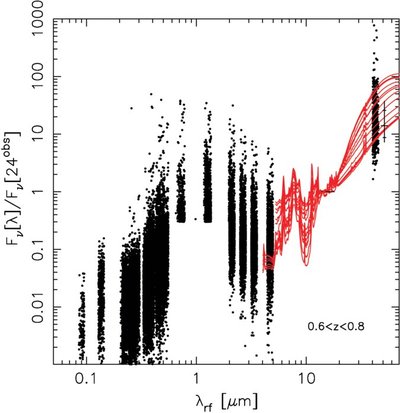
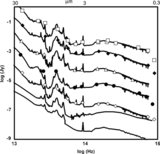
Caption: Figure 18.
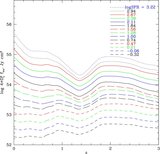
Comparison of templates with photometry at z ~ 0.7. The photometry is for galaxies in the EGS with [3.6] < 23 (a cut that is responsible for the truncation of the distribution of points near 1 μm toward low values), photo- z between 0.6 and 0.8 (Perez-Gonzalez et al. 2008a, 2008b), a detection at 24 μm and/or 70 μm (as measured in the DR2 FIDEL data; Dickinson et al. 2007), and an estimated value of L(TIR) larger than 10 11 L ☉. The vertical line and marks on the right of the 70 μm fluxes show the median, quartiles, and values enclosing 68% of the distribution of flux points. The templates and photometry are all normalized at observed 24 μm.
Other Images in This Article
Show More
Copyright and Terms & Conditions
© 2009. The American Astronomical Society. All rights reserved.