Image Details
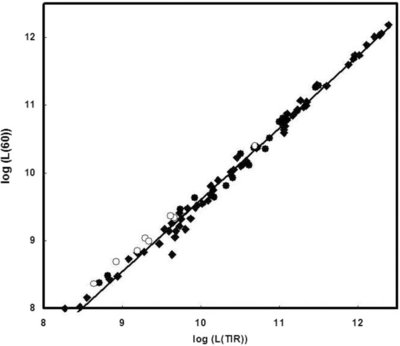
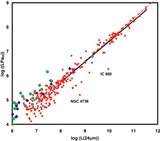
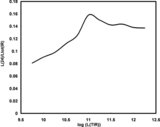
Caption: Figure 16.
Comparison of L(60) and L(TIR). The line is a linear fit given in the text. There are no outliers (not surprisingly because 60 μm is close to the maximum of the SED) but the slope differs somewhat from unity ( L(TIR) = 740 L(60) 0.943). Symbols are as for Figure 13.
Other Images in This Article
Show More
Copyright and Terms & Conditions
© 2009. The American Astronomical Society. All rights reserved.
Copyright ©
2026 Astronomy Image Explorer. All Rights Reserved.