Image Details
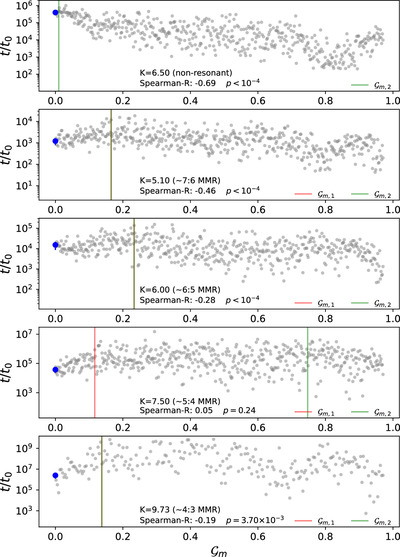
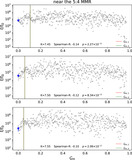
Caption: Figure 3.
Dynamical instability timescale t/t0 in relation to the modified Gini index ﹩{{ \mathcal G }}_{m}﹩ for planetary systems with K = 6.5 (nonresonant), K = 5.1 (near the 7: 6 MMR), K = 6.0 (near the 6: 5 MMR), K = 7.5 (near the 5:4 MMR) and K = 9.73 (near the 4:3 MMR). The blue dots represent the median dynamical instability timescales for equal-mass systems with the respective K values. The gray dots represent our simulations results on nonequal mass systems. The red vertical solid line marks the critical value ﹩{{ \mathcal G }}_{m,1}﹩, where the instability timescale t/t0 exhibits a positive correlation with ﹩{{ \mathcal G }}_{m}﹩ if ﹩{{ \mathcal G }}_{m}\lt {{ \mathcal G }}_{m,1}﹩. The green vertical solid line represents the critical value ﹩{{ \mathcal G }}_{m,2}﹩, where t/t0 shows an anticorrelation with ﹩{{ \mathcal G }}_{m}﹩ for ﹩{{ \mathcal G }}_{m}\gt {{ \mathcal G }}_{m,2}﹩. Note that the red and green vertical lines overlap in the second, third and final panel. Correlation coefficients and p values for Spearman's rank correlation between the overall ﹩\mathrm{log}(t/{t}_{0})﹩ and ﹩{{ \mathcal G }}_{m}﹩ are also included.
Other Images in This Article
Copyright and Terms & Conditions
© 2024. The Author(s). Published by the American Astronomical Society.