Image Details
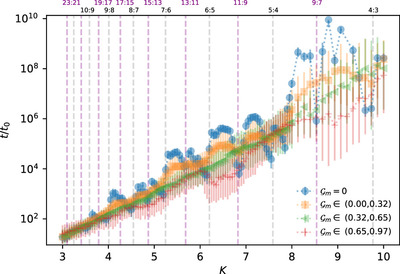
Caption: Figure 1.
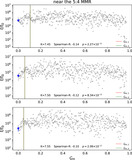
Dynamical instability timescale t/t0 as a function of the spacing parameter K. The error bars are given by the 16th and 84th percentile of the dynamical instability timescale distribution. Blue dots represent results from equal-mass systems, while the orange, green and red markers correspond to systems with modified Gini index ﹩{{ \mathcal G }}_{m}﹩ within the ranges [0, 0.32], [0.32, 0.65] and [0.65, 0.97], respectively. Gray and purple vertical dashed lines indicate the locations of first and second-order MMRs for planet pairs in equal-mass systems, respectively.
Other Images in This Article
Copyright and Terms & Conditions
© 2024. The Author(s). Published by the American Astronomical Society.
Copyright ©
2025 Astronomy Image Explorer. All Rights Reserved.