

Image Details
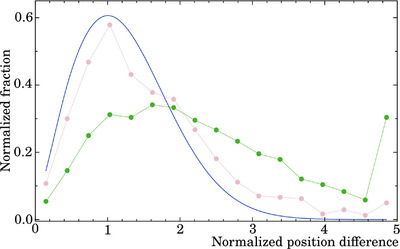
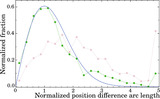
Caption: Figure 17.
The distribution of normalized arc lengths between the K-band and SX position estimates. The green bright circles show the distribution using original data. The pale pink circles show the distribution with the contribution of the residual ionospheric noise applied. The thick blue line shows the Rayleigh distribution with σ = 1 as a reference.
Other Images in This Article
Show More
Copyright and Terms & Conditions
© 2024. The Author(s). Published by the American Astronomical Society.

Copyright ©
2026 Astronomy Image Explorer. All Rights Reserved.
