

Image Details
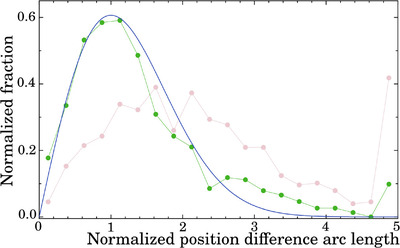
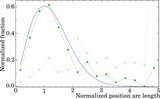
Caption: Figure 7.
The differences in normalized arc lengths between the source positions derived from the analysis of 2.2/8.4 and 4.1/7.4 GHz VLBA observations. The pale pink points show the histogram computed with original uncertainties and the green points show the histogram computed with inflated uncertainties.
Other Images in This Article
Show More
Copyright and Terms & Conditions
© 2024. The Author(s). Published by the American Astronomical Society.

Copyright ©
2026 Astronomy Image Explorer. All Rights Reserved.
